AP1 — Blocking the event loop
What goes wrong
FastAPI runs your async def routes on one event-loop thread. The loop switches between coroutines only at an await. A synchronous call such as requests.get() does not yield. It holds the thread until the gateway answers.
The Orders API calls a payment gateway, which is a slow I/O dependency. The demo gateway sleeps for one second on /delay/1. With three concurrent requests, the blocking version finishes them one after another. The async version overlaps them.
Blocking is invisible in unit tests and in a single curl. It only appears under concurrency, which is why it reaches production.
The bad code
The bad route is async def, but it calls requests, which is synchronous. This excerpt is from orders-api-demo/app/routers/demo_ap1.py.
@router.get("/bad")
async def blocking_call(request: Request) -> dict[str, str]:
    """`async def`, but `requests.get()` blocks the whole event loop for 1s."""
    settings = get_settings()
    resp = requests.get(f"{settings.payment_gateway_url}/delay/1", timeout=10)
    return {"gateway_status": str(resp.status_code), "mode": "bad-blocking-requests"}
The good code
The good route uses the shared httpx.AsyncClient from the lifespan and awaits it. The loop is free while the request is in flight.
@router.get("/good")
async def async_call(request: Request) -> dict[str, str]:
    """Same call via the shared httpx.AsyncClient — yields the event loop while waiting."""
    client: httpx.AsyncClient = request.app.state.http_client
    settings = get_settings()
    resp = await client.get(f"{settings.payment_gateway_url}/delay/1")
    return {"gateway_status": str(resp.status_code), "mode": "good-httpx-async"}
The bridge route keeps requests but moves it into run_in_executor. It is a migration bridge, not a fix. It still uses one thread-pool slot per call.
Try it
Run these with the Orders API and the gateway running. See Setup.
time (for i in 1 2 3; do curl -s -o /dev/null localhost:8000/demo/ap1/bad & done; wait)time (for i in 1 2 3; do curl -s -o /dev/null localhost:8000/demo/ap1/good & done; wait)time (for i in 1 2 3; do curl -s -o /dev/null localhost:8000/demo/ap1/bridge & done; wait)Expected (Postgres capture, Docker gateway): bad about 3.0 s, good about 1.0 s, bridge about 1.0 s.
For the most dramatic version, run curl localhost:8000/demo/ap1/bad in one terminal and curl localhost:8000/health in another right after. The health check waits until the bad call finishes. Repeat with /good and it answers at once.
Measured evidence
Captured output (benchmarks/ap1-blocking/latency-3-concurrent.txt):
=== BAD (requests.get() inside async def) ===
real: 3.046s total   (~1s x 3, fully serialized — the event loop is blocked
                       for the duration of each synchronous call)

=== GOOD (httpx.AsyncClient) ===
real: 1.040s total   (~1s total — all 3 requests run concurrently)
asyncio's debug mode also flags the blocking call (benchmarks/ap1-blocking/asyncio-debug.log):
WARNING:asyncio:Executing <Task ...> took 1.056 secondsThe good path produces no such warning.
Flame graphs, bad vs good
Bad
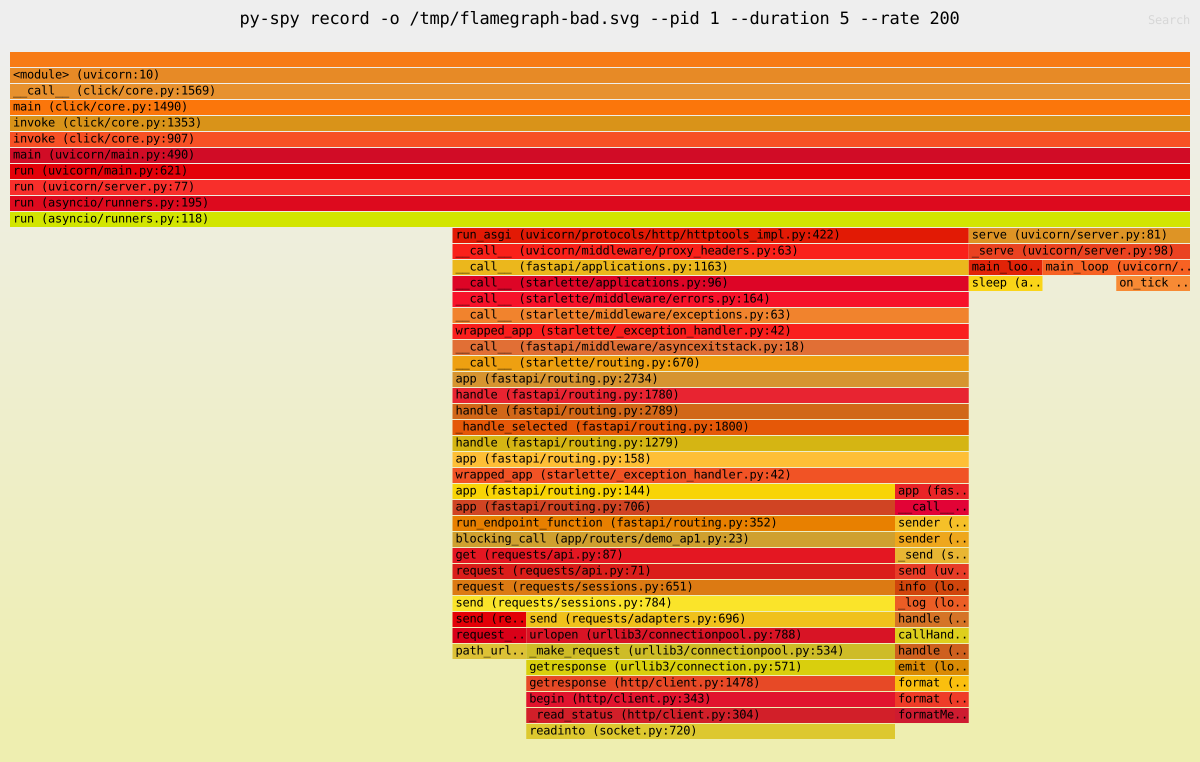
Flame graph of the bad path, sampled with py-spy during concurrent requests (talk/assets/ap1-flamegraph-bad.svg). Open the SVG to zoom in.
Good
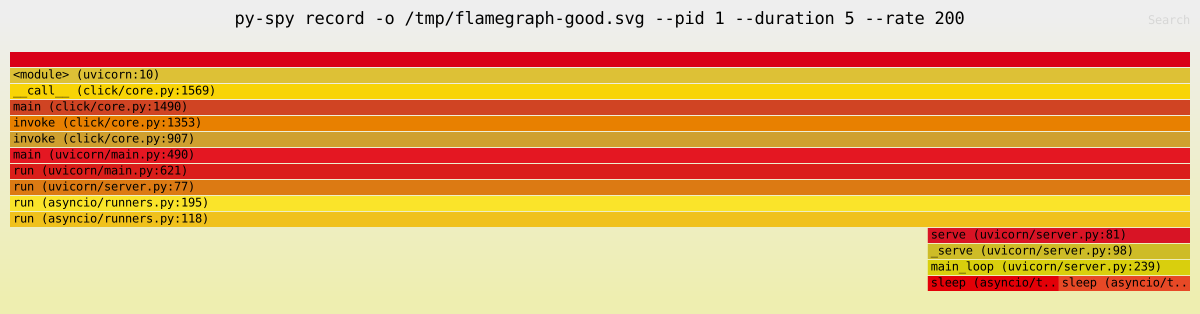
Flame graph of the good path, from the same kind of run (talk/assets/ap1-flamegraph-good.svg).
How to detect it in your own service
| Tool | Command | What to look for |
|---|---|---|
| asyncio debug mode | PYTHONASYNCIODEBUG=1 python app.py | Executing <Task ...> took X seconds warnings |
| py-spy | py-spy record --pid <PID> -o out.svg under concurrent load | A wide synchronous HTTP or DB frame inside an async route |
| A health check | curl /health while a slow route runs | Health hangs, which means the loop is blocked |
Grep for the usual suspects inside async def functions: requests., time.sleep, and synchronous file or database drivers.
Checklist
Talking points
- Total latency is the sum of all blocked calls. p99 collapses under concurrency even though each call "only" takes one second.
bridgeis a bridge, not a fix. It spends a thread-pool slot on every call.- uvloop does not fix this. It makes the loop faster but cannot interrupt a blocking call. See the FAQ.
- Live, the bad run takes about 3 seconds. Narrate while it runs, so the room does not sit in silence.